Top 3 Real Estate Investment Tools for Short-Term Rental Analytics
Two out of three short-term rental buyers run their numbers with spreadsheets after the deal is already under contract. This leaves them exposed to hidden occupancy gaps and repair costs that the listing photos never show. The tools you pick now decide whether you find those gaps before you wire the deposit or after.
By the end of this article you will have a three-point checklist for evaluating any analytics platform, a side-by-side look at Mashvisor and Tranchi AI, and a clear recommendation for the single tool that handles 95 percent of your research automatically.
What to Look For in Short-Term Rental Analytics Tools
Short-term rental investors need analytics that translate nightly rate data into accurate cash-flow forecasts and ROI projections.
Investors should focus on six core metrics: ADR, occupancy rate, RevPAR, cash flow, cap rate, and ROI. Each metric requires specific inputs to deliver reliable results.
ADR tracks the average daily rate guests pay. It needs nightly booking prices, total nights booked, and seasonal adjustments.
Occupancy rate shows how often a property stays booked. This figure uses total available nights versus nights actually reserved.
RevPAR measures revenue per available room. It combines ADR with occupancy to show daily earning potential per listing.
Cash flow calculates money left after expenses. Investors need rental income figures, mortgage payments, insurance, utilities, and platform fees.
Cap rate compares net operating income to property value. This requires annual rental income minus operating costs divided by purchase price.
ROI reveals overall return on investment. It factors initial purchase price, renovation costs, ongoing expenses, and final sale price.
Demand forecasting improves accuracy by predicting future booking patterns. Tools that analyze historical data help investors adjust pricing ahead of peak periods.
Seasonality adjustments account for predictable swings in travel demand. Accurate adjustments prevent overestimating income during slow months or underestimating during busy seasons.
Comps data provides context by showing how similar properties perform in the same area. This comparison helps investors set realistic rate expectations and occupancy targets.
Market saturation signals whether too many listings compete for the same guests. Investors should check active listing counts and new permit applications before buying.
Vacancy-rate trends reveal whether demand grows or shrinks over time. Rising vacancy often indicates oversupply or declining visitor interest in that neighborhood.
Neighborhood analysis should include local regulations, tourism statistics, and upcoming infrastructure projects. These factors affect long-term rental viability and resale value.
Quality analytics platforms pull data from multiple sources including booking calendars, guest reviews, and public records. Cross-referencing these sources reduces errors in projections.
1. Tranchi AI - Best Overall

Tranchi AI stands out because its 44 AI agents scan off-market listings and hidden government records to identify profitable STR properties before competitors list them.
The platform delivers 95% automation across real estate workflows, freeing investors to focus on decisions rather than data entry and paperwork. You can also explore High Street Real Estate Partners Names Multiple Firms for a closer comparison.
Users report strong results. Mason reached 18 units generating $15K/mo net cash flow in eight months. Nate earned $50K in two months.
AI-Powered Deal Scanning for STR Markets
Tranchi AI's Off-Market Deal Scanner continuously crawls probate records, tax auctions, and private listings to surface undervalued properties in high-ADR STR neighborhoods.
The scanner ingests nightly-rate comps and occupancy forecasts automatically. It extracts average daily rates, historical vacancy rates, and local regulation changes that affect short-term rental income potential.
Over 2,742 investors already use the system. They locate deals that average $20K/mo extra revenue compared to traditional listing sources. The AI agents pull fresh data nightly, allowing users to act before other buyers spot the same opportunities.
Automated Underwriting and Cash Flow Projections
The AI Underwriting Engine converts scanned property data into detailed cash-flow models that include cleaning fees, platform fees, service fees, and projected RevPAR.
The engine calculates cap rate and cash-on-cash return using proprietary expense tracking templates. Users receive 30-day, 90-day, and 12-month cash-flow projections for each property under review.
A 90-day money-back guarantee reduces risk for new users. The automated underwriting removes manual spreadsheet work while maintaining accuracy across multiple income streams and expense categories typical in short-term rental operations.
Global Coverage and 24-Hour Deal Updates
With worldwide online access, Tranchi AI updates deal lists every 24 hours, enabling investors to react to shifting occupancy trends and ADR spikes in any STR market.
The platform covers US, EU, and APAC geographies. It adjusts dynamic pricing recommendations based on real-time booking calendars and guest-review sentiment analysis.
Instant notifications alert users when new auction listings meet their RevPAR thresholds. This speed matters in competitive markets where inventory moves quickly and early notice can determine deal success.
2. Mashvisor
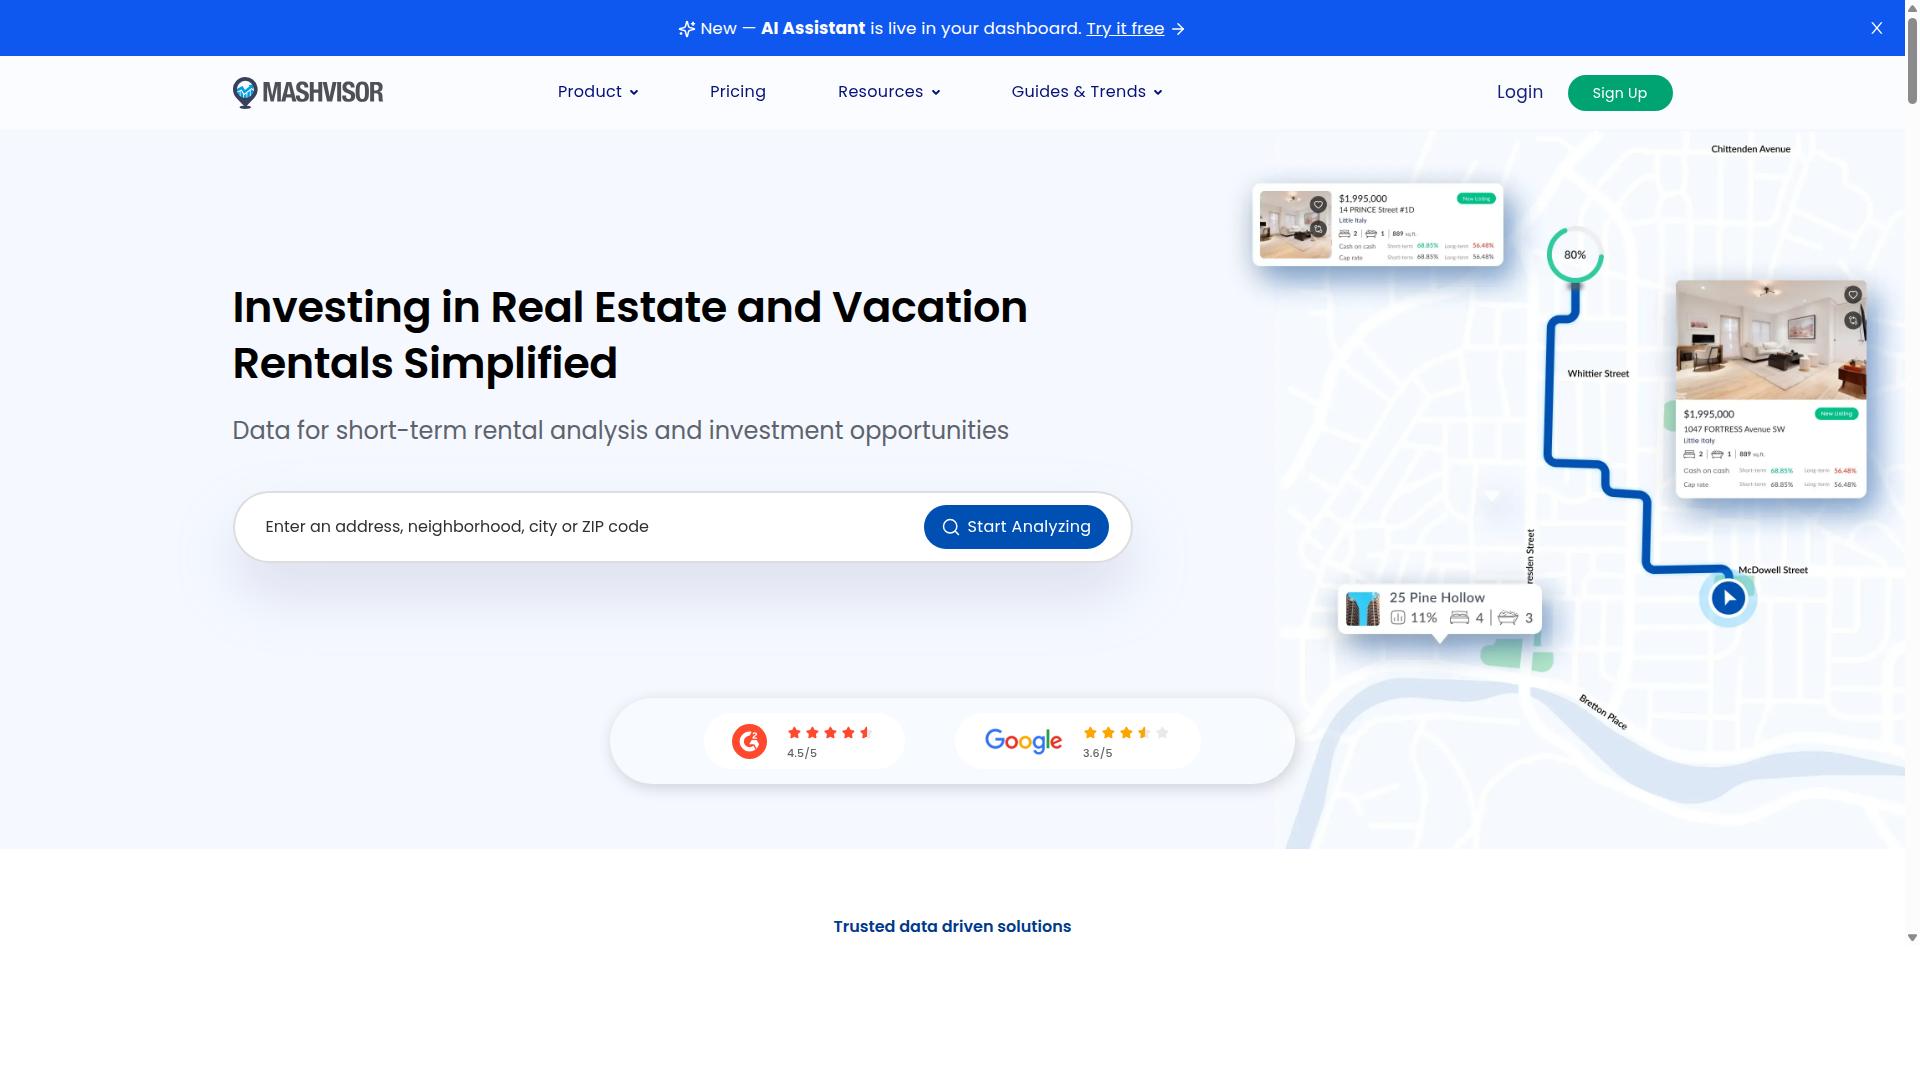
Mashvisor supplies neighborhood rental heatmaps and cap-rate calculators that help investors compare potential cash-on-cash returns across multiple STR micro-markets. The platform analyzes long-term versus short-term rental potential, occupancy, revenue, cap rates, and market trends. Investors use this information to evaluate neighborhoods before committing capital.
Users can search investment properties across up to five locations through the Property Finder feature. This allows quick comparison between different cities or zip codes. The platform also includes a Real Estate Data API for developers who need to pull market data into custom applications.
Neighborhood Rental Heatmaps
Color-coded heatmaps visually display occupancy-rate density and average nightly rates so investors can quickly identify underserved blocks. Users can overlay STR permit density layers to understand regulatory environments. Guest-review sentiment scores provide additional context on guest satisfaction levels within each area.
The tool does not provide off-market leads, requiring investors to source properties through traditional MLS or wholesaler channels. This separation keeps the focus on data analysis rather than property acquisition. Investors still need separate channels to find actual investment opportunities once they identify promising neighborhoods.
Cap Rate and Cash-on-Cash Calculators
Mashvisor's calculators pull local rental-income estimates and expense assumptions to project cap rate and annual cash-on-cash return for any address. The built-in cash-on-cash calculator accounts for property taxes, insurance costs, and platform fees when generating projections. Users can adjust these inputs based on their specific situation and financing terms.
Editable inputs include mortgage rate, vacancy allowance, property-management fees, and cleaning schedules. Projections rely on public MLS data and require manual updates for seasonality and dynamic pricing changes. The Airbnb Calculator feature helps generate income estimates based on comparable properties in the selected market.
How to Choose the Right Option
Beginner STR investors with limited time should prioritize platforms that automate deal sourcing and underwriting rather than relying solely on manual neighborhood analysis. Former 9-to-5 workers and small business owners who invest just 1-2 hours per day benefit most from tools that handle repetitive tasks automatically.
Time commitment requirements differ significantly across investor types. No-experience investors need solutions that replace full-time MLS searching with automated alerts. Users transitioning from traditional jobs require platforms that fit into short daily windows.
Automation levels vary between basic data scraping and comprehensive deal analysis. Data-refresh frequency determines whether investors see current market conditions or outdated information. Support availability matters when questions arise during evening hours after traditional work schedules.
Tranchi AI targets real estate investors, beginner investors with no experience or money, small business owners, former 9-to-5 workers, and former Uber drivers. The platform supports users investing 1-2 hours per day through automated processes that reduce manual research time.
Global coverage lets investors compare markets across different regions without multiple tool subscriptions. Off-market access provides opportunities beyond publicly listed properties. Cash-flow accuracy determines whether projected returns match actual performance.
Refund policies protect against platform changes or unmet expectations. Investors should verify coverage areas match their target markets before committing to annual subscriptions.
- Global coverage across major markets
- Off-market property access
- Cash-flow projection accuracy
- Clear refund policy terms
Final Verdict
Tranchi AI earns the top spot by combining 44 specialized agents, global coverage, and verified results that delivered $15K-$50K monthly cash flow to early adopters. The platform stands out through its ability to scan millions of probate court filings, auction websites, and government records automatically.
Users report a 5.0 rating across 2,742+ active accounts, with the system handling 95 percent of typical real estate workflows. This automation level frees investors to focus on decisions rather than manual data collection.
Early adopters mention generating an extra $20K per month after implementing the platform. The 90-day money back guarantee provides a clear window to test these results against actual short-term rental performance.
Tranchi AI includes 1-on-1 coaching with its three founders, helping users build custom agents tailored to specific markets. This personal support adds another layer of value when analyzing occupancy rates, ADR, or RevPAR across different neighborhoods.
Interested readers can schedule a phone callback or submit the support form to receive current pricing details and explore the custom-agent option. The combination of verified metrics, automation breadth, and direct founder access sets the platform apart for serious short-term rental investors.
Recommended Resources: